Advanced Data for Shared Mobility Operations – Webinar Recap
Summary
Nitin Maslekar, Head of Technology at MILES Mobility, joined us for a webinar on advanced data insights for shared mobility operations. Christoph Müscher and Christoph Mülder, INVERS’s software and hardware experts, overviewed the tools operators need to generate and visualize data effectively, while Nitin added examples from his own experiences with advanced data at MILES.
Bad shared mobility drivers are like bad apples: just a few can spoil the whole bunch. Operators want to encourage good driving behaviors to reduce crashes and maintenance costs, and to improve public perception and safety. Good driving behaviors are also eco-friendly, which aligns with the sustainability goals that most shared mobility services have. But to encourage good drivers and discourage the bad ones, operators must first be able to tell them apart; this is where advanced data insights can help. Here is what our webinar taught us about generating, visualizing, and using such insights for shared mobility operations:
Choose hardware that gets you the data you need from all your vehicles
Before they chose dedicated telematics from INVERS, Nitin and MILES considered two other types of hardware for advanced data insights:
- OEM telematics are perfectly aligned and calibrated to the vehicle they’re installed in at the factory. However, they usually don’t offer all the data that shared mobility operators need. Also, they can be inflexible, and harmonizing OEM data from different vehicles can be tricky.
- Phone-based apps are low-cost and quite flexible, but getting users to mount and align phones properly would be a problem. They are also prone to false positives when users pick them up or move them within vehicles.
Dedicated telematics units give the team at MILES the data they needed for advanced insights into driving behavior. They are also flexible enough to easily connect all the different types of cars in MILES’s fleet to one system. And since we designed them specifically for shared mobility, they provide the type of reliability that operators look for.
Learn more about the characteristics of hardware needed to detect unwanted driving behavior at 5:20 of the on-demand webinar.
Effective data visualization is key to quickly learning about vehicle and trip events
Nitin told a story of a user who called MILES with a request for service due to a flat tire. A quick look at the trip’s advanced data told the truth: the user had too much fun with the car on a parking lot and the flat tire was certainly a result of vehicle abuse:
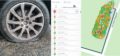
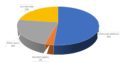
The visualization of data prior to this incident shows many aggressive driving events in a small space within a short time. The ability to easily filter and see vehicle data let MILES quickly understand exactly what happened before and during incidents, whether relatively minor ones such as this one or more serious ones like crashes or other accidents. These types of insights are key to letting shared mobility operators rely on their own data instead of on police reports and driver/eye-witnesses after incidents and accidents as most of them do now, according to our webinar poll on primary sources of info after a crash:
Data visualization is discussed starting at the 23:06 mark of the webinar recording.
Plan on making tweaks and improvements
Each shared mobility operation is different, and each fleet may have vehicles that need different advanced data settings. For example, the threshold for bad driving in a cargo van will be different than in a sporty hatchback. While INVERS’s Driving Analysis feature comes pre-set with threshold values that our testing generally shows to indicate bad driving, it’s in the operators’ interest to tweak and customize these values based on their own tests and research.
Operators should also expect to make improvements and tweaks to the way they use software for driving behavior insights. MILES, for example, currently uses data for better analysis of incidents and accidents like the one mentioned above. However, Nitin’s goal is to not only have good data to analyze past incidents, but to learn from data and use alerts to anticipate and prevent bad driving behavior in the future, and to encourage users to drive in a more sustainable manner as well.
It helps greatly to have an experienced partner to work through both the hardware tweaks and software customizations you’ll need to get the best advanced data insights. Please contact our experts to discuss how we can be that partner for you.
Related Posts
Car Sharing, Technology
The Hidden Cost of Reactive Maintenance in Car Sharing
Warning lights and missed alerts cost car sharing operators thousands per month. Here's how to cut maintenance tickets by 70%

Car Sharing, Technology
How can vehicle health data improve your car sharing?
We share our top 5 uses cases for using vehicle health data on warnings lights and service due dates to cut support calls, prevent breakdowns, and keep workshop service intervals on track.

Car Sharing, Technology
What a Smooth Telematics Migration Actually Looks Like
A telematics migration is not a single cutover event. Operators who run them well follow a structured 11-step framework across three phases: planning, execution, and handover.